matplotlib画柱状图十分简单,首先需要导入matplotlib中的pyplot,这个就是能够画图的类啦
import matplotlib.pyplot as plt
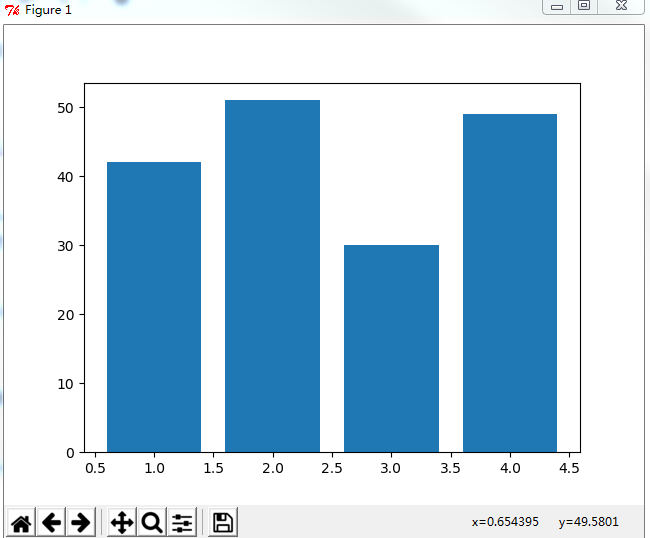
画柱状图十分简单,使用bar方法,比如画一个各个班级的人数吧,先准备一些数据,有两组数据,students为人数,这里放到y坐标系中,变量x就放在x坐标系中
students = [42,51,30,49]
x = [1,2,3,4]
好了,现在我们可以直接画出来,调用bar方法,最后再调用show就能画图啦,代码如下
plt.bar(x=x, height=students)
plt.show()
完整代码如下
#coding:utf-8
import matplotlib.pyplot as plt

students = [42,51,30,49]
x = [1,2,3,4]

plt.bar(x=x, height=students)
plt.show()
效果是这样的
你可能还喜欢下面这些文章
从程序员的角度来看, Shell本身是一种用C语言编写的程序,从用户的角度来看,Shell是用户与Linux操作系统沟通的桥梁。用户既可以输入命令执行,又可以利用 Shell脚本编程,完成更加复杂的操作。在Linux GUI日益完善的今天,在系统管理等领域,Shell编程仍然起着不可忽视的作用。深入地了解和熟练地掌握Shell编程,是每一个Linux用户的必修 功课之一。Linux的Shell种类众多,常见的有:Bourne Shell(/usr/bin/sh或/bin/sh)、Bourne Again Shell(/bin/bash)、C Shell(/usr/bin/csh)、K Shel
作为代码中,第一个看到的,极有可能就是define这个东西,称为宏!(define是可以出现在任何地方的,但是我们一般把这个写到最开始)然而,很多时候,初学者有时候可能看不懂她,因此,我的c语言学习的第一篇就写这个啦。define基本用法,简单定义最浅显的,define能用一个有含义的字符来替代一些数字,比如#define PI 3.141592654这样,假如以后要计算圆的周长或者面积,就可以用PI这个字符而不用写3.141592654啦。比如#define PI 3.141592654#include "stdio.h"int main(){ int r = 3; float
机器搬家之后,之前一直稳定的PHP多进程程序子进程突然异常退出,但是退出的不是很频繁,查看进程日志并也没有发现有什么导致退出的,问题比较诡异。于是开启了一段问题排查之路。首先查看内核日志,使用dmesg,拉到最后发现有一些这样的错误,看来确实是崩溃了。 php: segfault at 7f6443ee18c8 ip 00007f6443ee18c8 sp 00007fff4d4ba818 error 15 in libc-2.17.so php: segfault at 0 ip 000000000075919d sp 00007fff0c6e0578 error 4 in php trap
在制作一个页面的时候,有需要前台js保存用户自定义的样式的需求,但是保存之后,重新刷新页面,会显示原来的样式,然后再变更为现在的自定义的样式。这是一个有闪烁的例子,点击打开保存样式之后,再重新强制刷新几次,可以看到页面在载入的时候会出现闪烁的情况。强迫症患者表示这不能接受,页面这么小的情况都闪烁的这么厉害,这页面大了,加载速度慢了,自定义样式还得等着加载完成之后才能显示,就失去了自定义的意义了。上面的闪烁是可以理解的,css渲染完成之后,js给body增加了一个class,浏览器又会重新渲染,因此会出现短暂的闪烁那么在渲染到head的时候,此时再用js给head标签里面增加css呢?这样不就在
centos7系统初初始化工作以及网站环境搭建(php7+nginx+mysql)
拿到一台做网站的主机, 我们先要做一些环境初始化的工作, 由于这些工作会有些繁琐,因此记录一下. 后面将这些流程写成一个shell脚本,一次性完成.此次工作流程如下: 安全性设置 额外的目录创建 网站环境搭建安全性设置一般从某云上买的主机, 默认账户是root, 为了不被暴力破解, 我们首先需要设置一个强一点的密码,不过更好的方法是禁用root, 另外创建一个用户来作为日常管理的账户.第一步: 创建一个新的账户,并且能够切换到root权限比如我的用户名叫xiaobai, 添加用户名就是useradd xiaobai设置密码passwd xiaobai之后输入密码,一个新的账户就设定好了.
这是我的Go学习笔记的第四篇,面向对象!现代语言几乎都会面向对象进行了支持!当然,Go也具备面向对象的特性!我的语言学习过程一般分为下面几个:1. 变量和数据类型2. 流程控制方法3. 函数声明和调用4. 面向对象5. 语言特性6. 标准库Go语言中的面向对象有点特殊。在Go语言里面,没有显式的class、extends等面向对象语言经常使用的关键词,但是却有面向对象的特性。看看Go怎么实现的把!创建一个类按照我的理解,类实际上就是某种模板,这个模板里面含有有限多个属性和方法。在Go里面,定义这个模板的语法使用type来实现!比如单个int类型可以构成一个类(没错,你甚至可以在int数据类型上
这是我的C++学习笔记第一篇,同所有的程序语言学习路径一样,首先学习的是变量和数据类型。我的学习路径如下:1. 变量和数据类型2. 流程控制3. 函数声明和调用4. 面向对象5. 标准库这一章,学习的是变量和数据类型,需要了解的有:了解这些,对于变量基本就够了。Hello world在开始之前,先写一个hello world来熟悉一下程序的主要结构以及如何打印一个变量。iostream提供标准输入输出的头文件,程序以main函数问入口,std为标准库的命名空间,“<<” 为输出操作符,std::cout为标准输出,std::endl为结束符,表示将等待输出的内容从内存传送到标准输出
当我们在谈到cgi的时候,我们在讨论什么最早的Web服务器简单地响应浏览器发来的HTTP请求,并将存储在服务器上的HTML文件返回给浏览器,也就是静态html。事物总是不 断发展,网站也越来越复杂,所以出现动态技术。但是服务器并不能直接运行 php,asp这样的文件,自己不能做,外包给别人吧,但是要与第三做个约定,我给你什么,然后你给我什么,就是握把请求参数发送给你,然后我接收你的处 理结果给客户端。那这个约定就是 common gateway interface,简称cgi。这个协议可以用vb,c,php,python 来实现。cgi只是接口协议,根本不是什么语言。下面图可以看到流程WEB服
项目做多了之后,可能会慢慢总结出自己的代码库出来,当在新的项目中使用的时候,总不能一直是复制粘贴。这个时候,composer就能派上用场了。一个项目开始,使用composer就能够加载所需要的依赖,非常方便。这个时候,来做一个自己的包吧!使用命名空间composer自动加载需要用到命名空间,因此所有的代码库都需要使用命名空间,如果没有,那就改吧!使用命名空间之后你可能会打开新世界的大门。创建composer.json我假设你已经安装了composer,并且已经会使用了。创建自己的包我们首先需要创建一个composer.json,示例文件如下上面的composer.json有一个比较重要的是au
布隆过滤器(bloom filter)介绍以及php和redis实现布隆过滤器实现方法
引言在介绍布隆过滤器之前我们首先引入几个场景。场景一在一个高并发的计数系统中,如果一个key没有计数,此时我们应该返回0。但是访问的key不存在,相当于每次访问缓存都不起作用了。那么如何避免频繁访问数量为0的key而导致的缓存被击穿?有人说, 将这个key的值置为0存入缓存不就行了吗?这是确实是一种解决方案。当访问一个不存在的key的时候,设置一个带有过期时间的标志,然后放入缓存。不过这样做的缺点也很明显:浪费内存和无法抵御随机key攻击。场景二在一个黑名单系统中,我们需要设置很多黑名单内容。比如一个邮件系统,我们需要设置黑名单用户,当判断垃圾邮件的时候,要怎么去做。比如爬虫系统,我们要记录下
